
Abstract
Inside-out membrane modules are engineered so that feed water enters through the hollow fiber lumen and permeate exits radially outward through the fiber wall—a configuration that concentrates hydraulic stress precisely where fouling and mechanical fatigue begin. For procurement engineers and plant operators, understanding which failure mode appears first is not an academic exercise; it directly determines maintenance intervals, spare-part stocking strategy, and total cost of ownership.
Three failure modes dominate field experience: fiber blockage, potting seal degradation, and flux decline. These are not independent events. They form a causal chain, and the first link—fiber blockage—is both the most common initiating event and the most preventable. This article provides a structured diagnostic framework, benchmarked operating parameters, and specification checkpoints to help B2B buyers evaluate module reliability before purchase and manage performance throughout service life.
How Inside-out Membrane Modules Work and Why Failure Sequencing Matters
Flow Path Architecture and Stress Distribution
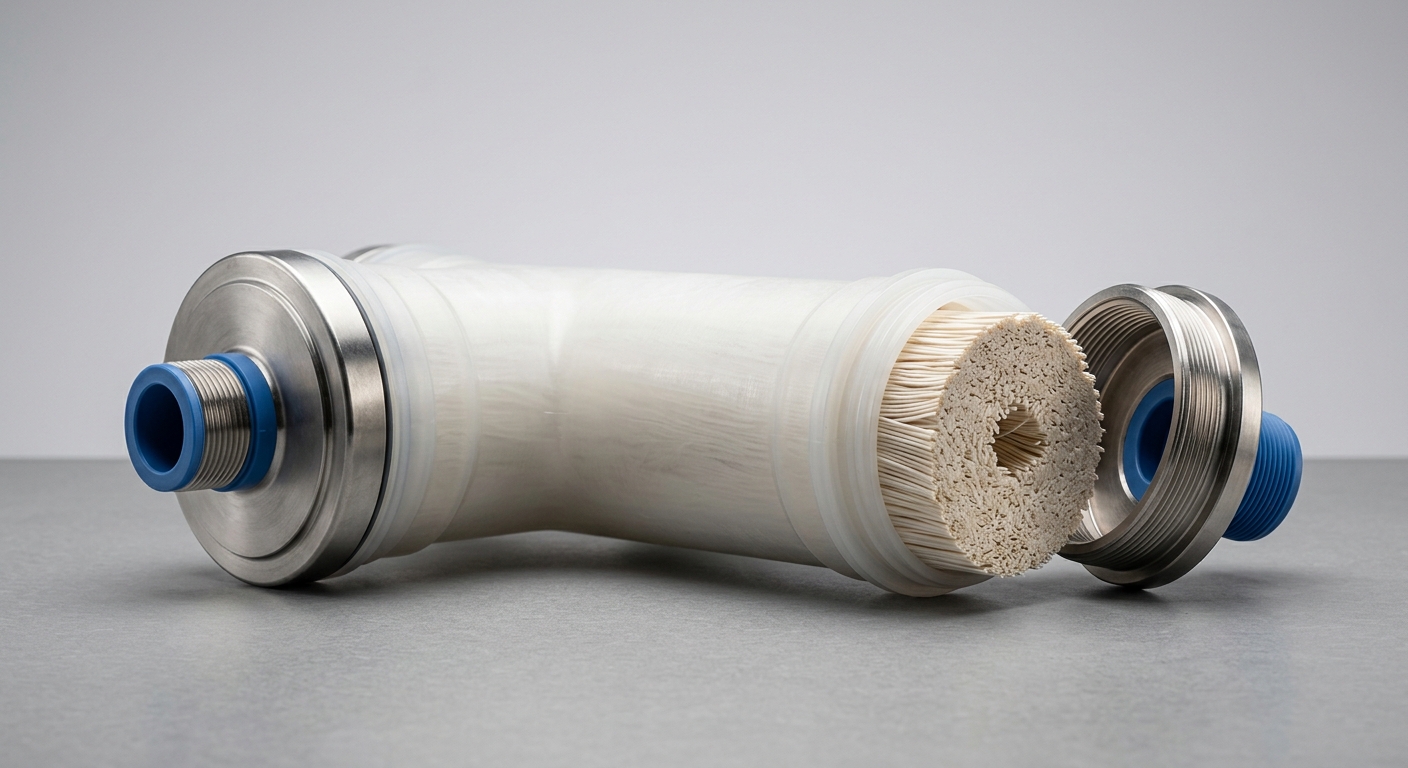
In an inside-out configuration, pressurized feed water enters the fiber lumen from one or both ends. As it travels axially, hydraulic pressure drives permeate radially outward through the ultrafiltration or microfiltration membrane wall. The concentrate exits from the opposite end or is recirculated.
This architecture creates a predictable stress gradient. Pressure is highest at the fiber inlet, which means particulate loading, velocity shear, and fouling potential are all concentrated at the same anatomical point. The fiber wall—typically 0.2–0.5 mm thick—bears the full transmembrane pressure (TMP) differential. End caps and potting zones experience cyclic mechanical stress each time the system pressurizes or backwashes. Understanding this geometry makes the failure sequence logical: the highest-stress zone fails first, and that zone is the fiber inlet and lumen wall.
The Three Primary Failure Modes — An Overview
Fiber blockage, seal failure, and flux decline are frequently treated as separate diagnostic categories, but they are causally linked. Fiber blockage raises TMP, which amplifies mechanical stress on potting seals. Sustained seal micro-leakage then allows particulate bypass, accelerating irreversible membrane fouling and producing the flux decline that most operators notice last—often after the damage is already done.
Establishing this diagnostic priority order—blockage first, seal stress second, flux decline as confirmation—gives maintenance teams a measurable early-warning framework rather than a reactive response protocol.
Fiber Blockage — The First Failure Indicator in Most Operating Conditions
Early Warning Signs and Root Causes
Fiber blockage initiates at the lumen inlet face, where suspended solids, colloidal particles, and biological matter accumulate in a cake layer. The earliest measurable signal is a rising TMP at constant flux—typically detectable within hours to days of a feed water quality excursion. Biofouling initiation is slower but more insidious: extracellular polymeric substances (EPS) form a gel matrix that resists standard backwash pressures and progressively reduces effective lumen diameter.
Key early warning indicators include:
- TMP rise rate exceeding 0.05 bar/hour at steady flux
- Normalized permeability dropping more than 15% between cleaning cycles
- Feed-to-concentrate pressure differential increasing without corresponding flow rate changes
- Backwash return permeability failing to recover to ≥90% of baseline
Root causes divide into two categories: feed water quality excursions (SDI spikes, turbidity events, biological loading) and operational deviations (insufficient backwash frequency, inadequate crossflow velocity, pre-treatment bypass).
Operating Parameters That Accelerate Blockage
Procurement teams should verify that supplier-stated operating limits align with actual site conditions. The table below benchmarks critical parameters against field-validated thresholds:
| Мембранная система под давлением | Acceptable Operating Range | Early Warning Threshold | Critical Failure Threshold |
|---|---|---|---|
| TMP Rise Rate | < 0.03 bar/hour | 0.03–0.07 bar/hour | > 0.07 bar/hour |
| Silt Density Index (SDI₁₅) | < 3 | 3–5 | > 5 |
| Backwash Interval | Every 20–45 min | > 60 min without CEB | > 90 min |
| Feed Turbidity (NTU) | < 1 NTU (post-pretreatment) | 1–5 NTU | > 5 NTU |
| System Recovery Rate (%) | 85–95% | 95–97% | > 97% |
When SDI₁₅ exceeds 5 or feed turbidity consistently surpasses 1 NTU post-pretreatment, fiber blockage transitions from a manageable fouling event to a structural risk. At elevated recovery rates above 97%, concentrate-side scaling and fiber-end deposition accelerate proportionally.
Seal Failure and Flux Decline — Sequential or Simultaneous?
Potting Seal Degradation — Signs, Timeline and Detection Methods
Potting compounds—typically epoxy or polyurethane—anchor the fiber bundle within the module housing and provide the pressure boundary between feed and permeate sides. Degradation follows two distinct pathways: chemical attack and mechanical fatigue.
Chemical degradation occurs when potting material contacts feed streams containing strong oxidants (free chlorine > 0.1 ppm for polyurethane), high-pH caustic solutions, or organic solvents. Epoxy formulations generally offer broader chemical resistance but lower flexibility under pressure cycling. Polyurethane potting tolerates mechanical vibration better but is more vulnerable to oxidative environments.
Pressure cycling fatigue is cumulative. Each backwash cycle—potentially 30–50 events per day—imposes a micro-stress cycle on the potting interface. Seal micro-cracks typically appear after 12–24 months in high-frequency backwash applications, manifesting as:
- Failed pressure hold tests: pressure decay exceeding 0.1 bar/min during integrity testing
- Bubble point anomalies indicating localized seal bypass
- Elevated permeate turbidity without corresponding TMP increase (a diagnostic signature of seal bypass rather than membrane fouling)
Integrity testing should be conducted quarterly under normal operation and immediately following any TMP excursion event.
Flux Decline as a Lagging Indicator — Measurement and Misinterpretation Risks
Flux decline is the operational symptom most operators notice, but it is almost always a lagging indicator of upstream failure events. The critical distinction is between reversible flux decline—caused by removable fouling layers and recoverable through chemical enhanced backwash (CEB)—and irreversible flux decline, which indicates membrane compaction, fiber wall damage, or permanent pore occlusion.
Normalized flux (NF), corrected for temperature and feed pressure, is the correct KPI. A single-point flux reading without normalization routinely misleads operators into attributing seasonal temperature effects to membrane degradation.
Misinterpretation risk is highest when flux decline appears suddenly. A rapid flux drop of > 20% over 24–48 hours more commonly indicates an upstream pre-treatment failure—media filter breakthrough, coagulant dosing interruption—than membrane damage. Systematic root-cause analysis should always interrogate pre-treatment performance before concluding that the module itself has failed.
Application-Specific Failure Patterns and Module Selection Criteria
Industrial vs. Municipal vs. Reuse Applications — Failure Mode Frequency Comparison
Feed water composition fundamentally shifts which failure mode dominates and how quickly it manifests:
- Industrial effluent treatment: High suspended solids, variable pH, and potential surfactant or solvent contamination make fiber blockage and potting chemical degradation the co-dominant failure modes. Modules must be specified with chemically resistant potting and frequent CEB protocols.
- Municipal surface water treatment: Seasonal biological loading (algal blooms, NOM spikes) drives biofouling-initiated blockage. TMP monitoring cadence should increase during high-turbidity seasons.
- MBR and water reuse applications: Mixed liquor suspended solids (MLSS) concentrations of 8,000–15,000 mg/L create extreme inlet loading conditions. Flux decline is faster and more frequent, but often reversible if relaxation and backwash cycles are correctly optimized. Seal fatigue from high backwash frequency is the long-term reliability concern.
Specification Checkpoints for B2B Procurement
Three structural specifications directly predict failure resistance and are frequently under-specified in procurement documents:
- Fiber ID/OD ratio: A larger inner diameter relative to outer diameter reduces lumen-side hydraulic resistance and delays blockage onset. For high-turbidity feeds, specify fiber ID ≥ 0.8 mm.
- Packing density: Higher packing density increases membrane area per module but reduces inter-fiber spacing, accelerating shell-side fouling in inside-out configurations. Verify that the supplier’s stated packing density is validated for your specific feed water matrix.
- Module housing material compatibility: Polysulfone and PVDF housings offer broad chemical resistance. Verify compatibility against your CIP chemical regime—particularly caustic (NaOH) concentration and temperature—before finalizing supplier selection.
Часто задаваемые вопросы
Q1: How early can fiber blockage be detected before it causes irreversible damage to an inside-out membrane module?
TMP rise rate is detectable within the first operational hours of a feed quality excursion. Automated TMP trending with alert thresholds set at 0.05 bar/hour provides actionable lead time of 12–48 hours before blockage becomes irreversible. Integrating online turbidity monitoring at the module inlet further extends the detection window.
Q2: What seal material should I specify for inside-out modules handling high-temperature or chemically aggressive feed streams?
For feed streams above 40°C or containing oxidants and caustic concentrations used in aggressive CIP protocols, specify epoxy potting compounds with documented resistance to your specific chemical regime. Request supplier-provided chemical compatibility data sheets and ask for field references in comparable applications. Do not rely on generic material classifications alone.
Q3: Is a sudden flux decline always a sign of membrane failure, or can it indicate an upstream pre-treatment issue?
A sudden flux decline—particularly one that responds partially to backwash—more often indicates a pre-treatment failure than membrane damage. Check coagulant dosing, media filter differential pressure, and feed turbidity logs for the 24 hours preceding the event before initiating module replacement decisions. Irreversible membrane damage typically produces a gradual, non-recoverable decline pattern rather than a step-change event.
Заключение
The failure sequence in inside-out membrane modules follows a consistent pattern across most industrial and municipal applications: fiber blockage initiates first, potting seal stress follows as a consequence of elevated TMP cycling, and measurable flux decline appears last—often after preventable damage has already occurred. Procurement engineers who build this sequence into their vendor qualification criteria, specifying TMP tolerance limits, potting material compatibility data, and mandatory integrity test protocols, gain a structural advantage in minimizing first-failure risk and extending module service life.
Operational teams benefit most from treating TMP rise rate as the primary early-warning KPI, maintaining normalized flux trending to separate membrane performance from pre-treatment variability, and scheduling integrity testing on a proactive quarterly cadence rather than in response to permeate quality failures. The modules that perform longest in demanding applications are not necessarily those with the highest nominal flux ratings—they are the ones specified, monitored, and maintained against a rigorous, failure-sequence-aware framework.